GADGET
The GADGET web server is designed to allow users to explore the genetic basis of human phenotypic diversity. GADGET integrates trait-implicated single nucleotide polymorphisms (SNPs) from GWAS, with population genetic data from the 1000 Genomes Project (1KGP), to calculate genome-wide polygenic trait scores (PTS) for hundreds human phenotypes in thousands of individual genomes. Users are able to (1) explore the global of distributions of pre-computed genome-wide polygenic trait scores (PTS) for a wide variety of human phenotypes, and (2) compute worldwide PTS distributions for user-defined traits of interest.
Heritability and human population genetic variation
Heritability is the amount of phenotypic variation that can be attributed to individual genetic differences; all human traits that have been measured thus far show evidence for some degree of heritability. Given that (1) the expression of heritable traits is influenced by genetic variants, and (2) the frequencies of most genetic variants vary among human populations, heritable traits are expected to differ among populations. Indeed, there are numerous examples of heritable traits that vary widely across human populations.
The genetic architecture of human traits
The genetic architecture underlying heritable human traits can be deciphered via genome-wide association studies (GWAS). Hundreds of GWAS studies have been used to discover thousands of genetic variants (SNPs) that influence the expression of a wide variety of human traits, including anthropomorphic, behavioral, and health-related phenotypes. We mine the NHGRI-EBI GWAS Catalog, the PubMed database, and the EBI Experimental Factor Ontology to curate sets of SNPs that shape the expression >800 human traits. Trait descriptors parsed from the Experimental Factor Ontology are hierarchically organized into a custom ontology, which can be explored here: Jordan Lab Trait Ontology.


Human genome variation worldwide
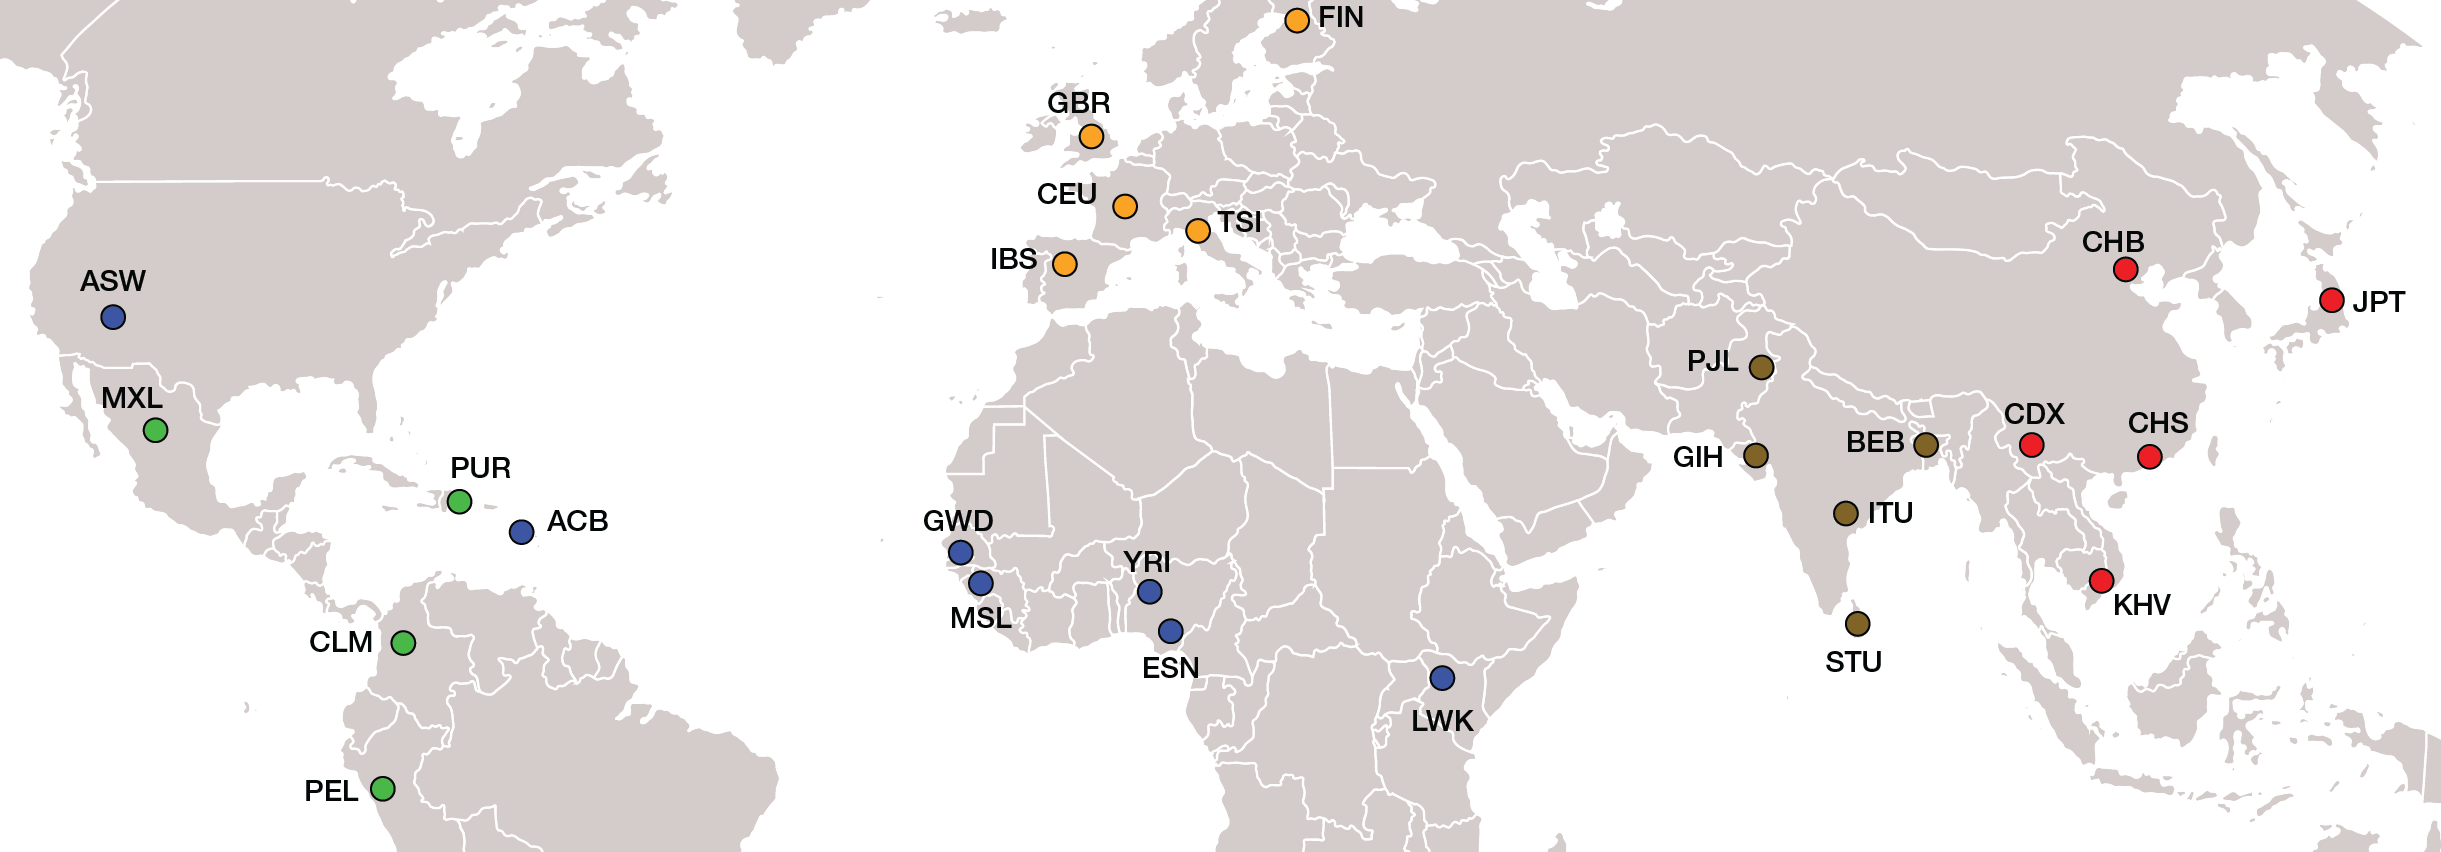
The 1000 Genomes Project (1KGP) provides a deep catalog of global human genetic variation. The 1KGP characterized complete genome sequences for 2,504 individuals from 26 global populations, organized into five continental (super) population groups: Admixed American (green), African (blue), East Asian (red), European (yellow), and South Asian (brown). We consider the presence of trait-implicated SNP effect alleles in individual human genomes to calculate genome-wide polygenetic trait scores (PTS), and then we evaluate the distributions of PTS across global populations.
Genome-wide polygenic trait scores (PTS)
Genome-wide polygenic trait scores (PTS) have emerged as a powerful tool for predicting individuals’ phenotypes based on the numbers of effect (risk) alleles encoded in their genomes. PTS can be computed by summing the numbers of effect alleles encoded in an individual genome, and scores can be weighted by considering allele effect sizes. In the case of health-related phenotypes, PTS are often referred to as genetic risk scores, reflecting the predicted health risk to individuals entailed by the presence of disease-implicated variants in their genomes.
Unweighted PTS () are calculated as the normalized sums of the number of effect alleles found in the genome for all trait-associated SNPs:
where corresponds to homozygous absent, heterozygous or homozygous present risk alleles at each SNP and corresponds to the total number of alleles with basecalls at each SNP. Weighted PTS () employ effect size estimates, either odds ratios or β-values, to weight the numbers of observed effect alleles for each trait associated SNP:
where is the SNP-specific effect size estimate.
Statistical significance
Population variance levels for trait-specific PTS are measured using ANOVA, among the five continental population groups, with F-statistics, P-values and false discovery rate (FDR) q-values reported in the trait table.
Caveats for the interpretation of PTS across populations
It is important to note that GADGET is intended as a tool for researchers to explore population-specific distributions of genetic variants that have been associated with a wide variety of human traits. Users of this site should treat the results with caution, as the interpretation PTS across populations can be complicated by a number of factors. Heritability is defined only in the population in which it is measured, and the extent to which specific SNP-trait associations are shared across populations is a matter of active investigations. On the one hand, many trait associated SNPs, or the haplotypes where they are located, are shared across populations. On the other hand, recent studies have shown that demographic factors (e.g. genetic drift) can confound attempts to compare PTS across populations.
There are a number of possible alternative explanations that can be invoked to explain PTS differences across global populations. Some of the possible explanations for PTS differences among global populations are: (1) the genetic predisposition to the trait differs among populations, (2) the top SNPs used for the analysis differ among populations, but the overall genetic predisposition for the trait would balance out if additional SNPs were included in the PTS calculation, (3) the apparent population differences in genetic predisposition for any given trait could disappear due heterogeneous effects sizes among populations, (4) observed population differences in PTS could be due to stochastic effects related to demographic factors (e.g. genetic drift). In addition, problems with the original GWAS studies or issues with accuracy of the GWAS database used to generate trait-associated SNP sets could also cause problems with global PTS distributions. In light of these caveats, PTS results generated by GADGET should be treated with caution.